Atomiton EcoTransform
✺ UX/UI Designer · Silicon Valley team, remote · 2023 → 2025
Two years with a Silicon Valley team, turning sprawling AI infrastructure into dashboards an operator can read on a single screen.
Context. Atomiton builds AI and IoT infrastructure management software for enterprises. Over two years working remotely with the US team, I designed the dashboards at the heart of the product: hundreds of servers, clusters and model replicas that have to read clearly on one screen.
Design decisions.
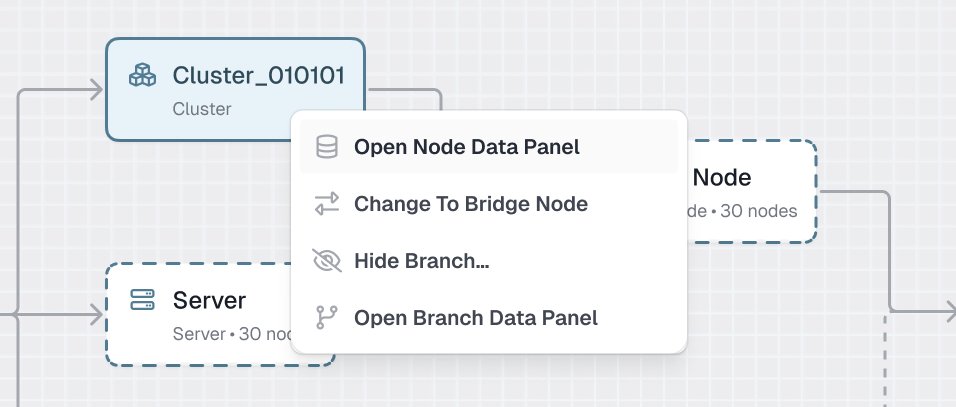
- The topology graph is the primary language. Instead of endless data tables, operators read the system as a graph and open any node in place.
- Reveal detail on demand. Context menus and node and branch panels separate overview from detail. A single branch can hold 761 nodes, so the interface summarizes them first, then lets operators drill into any individual record.
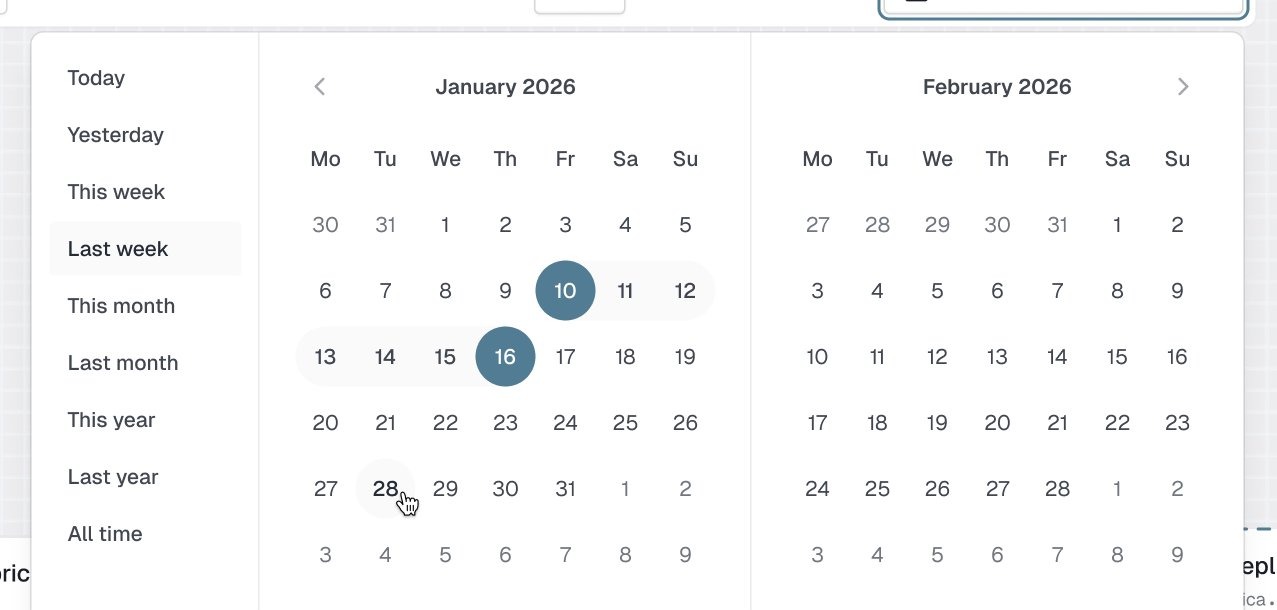
- Time is a data dimension. Time lapse, hour/day/quarter filters and a custom range picker, because an infrastructure incident is always the question "what happened right then".
Shown with sample data from a demo environment to keep client data confidential.
✺ One decision, start to finish
A graph first, the numbers one click away.
- Problem
Operators run AI infrastructure with hundreds of servers, clusters and model replicas, and need the state of the whole system on one screen before they dig in.
- What I saw
A single branch in the demo environment holds 761 nodes. Listed all at once, that is a spreadsheet nobody can read.
- Options
Long data tables, the default for enterprise tools, or a topology graph with the numbers kept one step away.
- Choice and cost
The graph leads; context menus and node and branch panels open the detail only when asked. The cost is one more click to reach a raw number, so every deep action starts from the node the operator is already looking at.
- What happened
Graph first became the backbone of the dashboards I designed over two years with the US team, from English requirements to handoff-ready specs. The screens use demo data to keep client data private.